
By Jon Ackland, co-founder and chief science officer, Performance Lab, Special to SportsMD
My fitness tracker sometimes gets confused. It’s also repetitive. My goal for today is 10,000 steps. Tomorrow, it’s 10,000 steps. For my whole &%$@ing life, it’s 10,000 steps. If I am doing well, I need to do 10,000 steps, and if I’m struggling, I should do 10,000 steps anyway. Well, I’ve contracted that job out…

Figure 1. Is this cheating? Delegation is an important part of (health) management
My wearable is sometimes embarrassingly inappropriate. Here I’m being “alerted” to stand up in a meeting. This alert also occurred recently during a eulogy at a funeral.
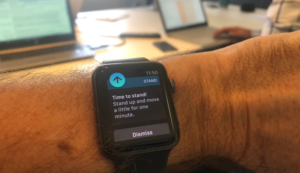
Figure 2. “Time to Stand” alert on Apple Watch in a meeting.
My wearable is not very smart. Did you know the resting heart rate of toilet paper?
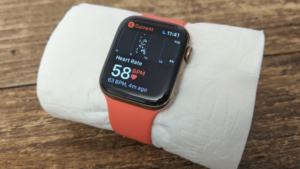
Figure 3. Optical heart rate monitors can be tricked into measuring the heart rate of objects. (Try it!)
So, how do we get smarter and more personal with wearable data? First, we have to get data to mean something.
Fitbit states on its website that it has 160 billion active minutes and 108 billion hours of heart rate data. What does 108 billion hours of heart rate data even mean?
Heart rate can’t be measured in isolation. There are about nine things that can affect your heart rate.
- Level of exertion
- Temperature
- Being at altitude
- Feeling stressed or anxious
- Fatigue
- Illness
- Fitness
- Age
- A heart abnormality.
My heart rate at the moment is 63b/min. Do you know what I’m doing? Of course not!
At Performance Lab we discovered early on that to make data meaningful, context is everything. This means attaching all contributing factors to measurement.
Consider an example, where your tracker says, “Your heart rate is up, you are exercising too hard!”
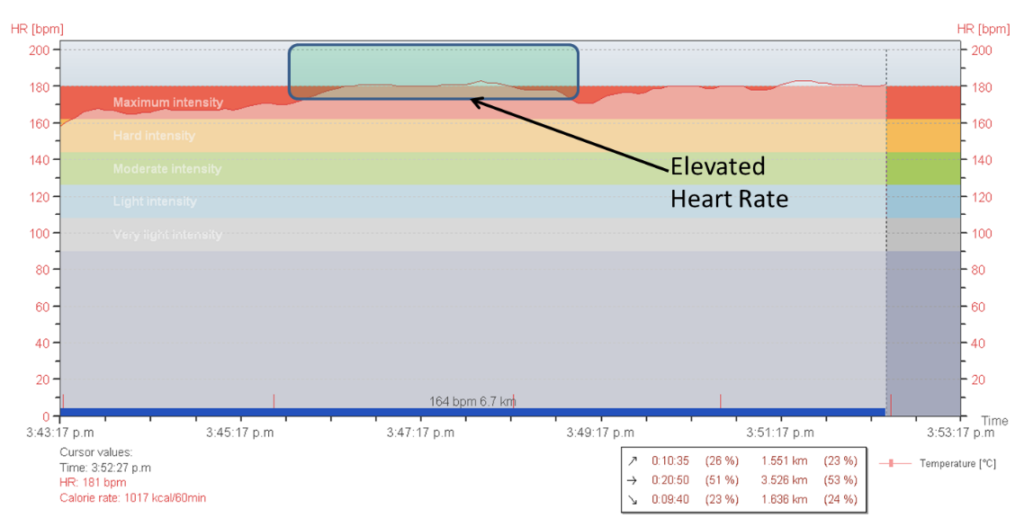
Figure 4. Running heart rate measured over time using a polar heart rate monitor.
Turns out you are just running up a hill.
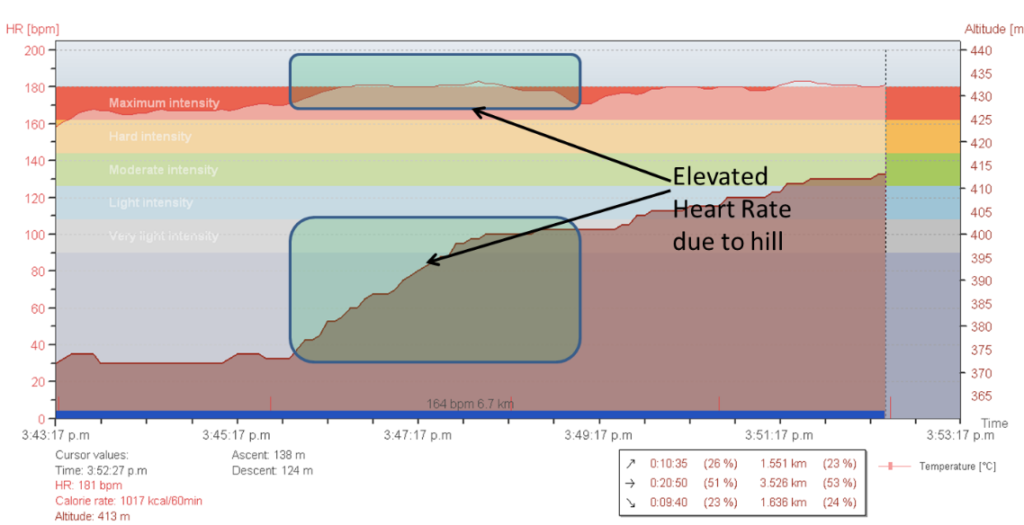 Figure 5. Running heart rate and altitude measured over time using a polar heart rate monitor.
Or maybe the monitor says, “You’ve slowed down, try harder!”
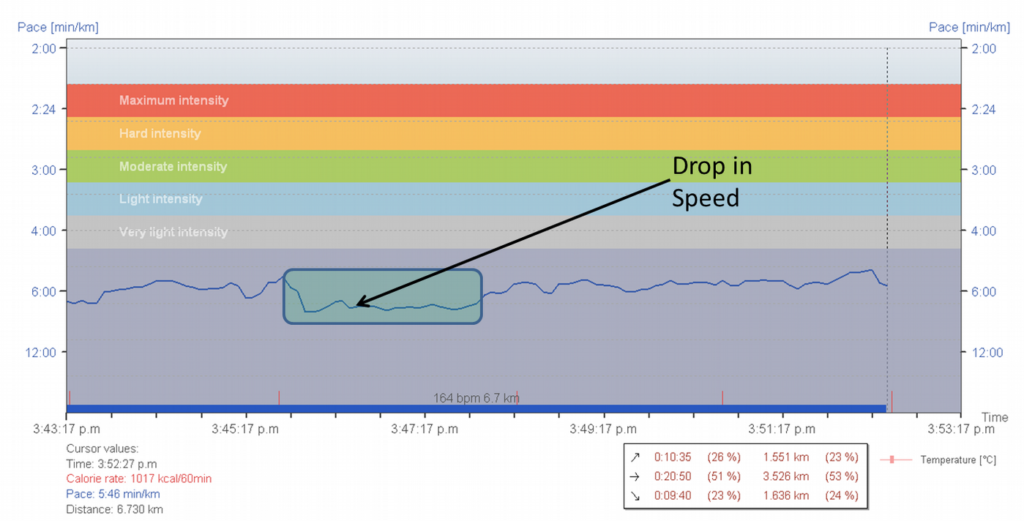
Figure 6. Running speed over time using a polar heart rate monitor.
Ah, you’re running up a hill.
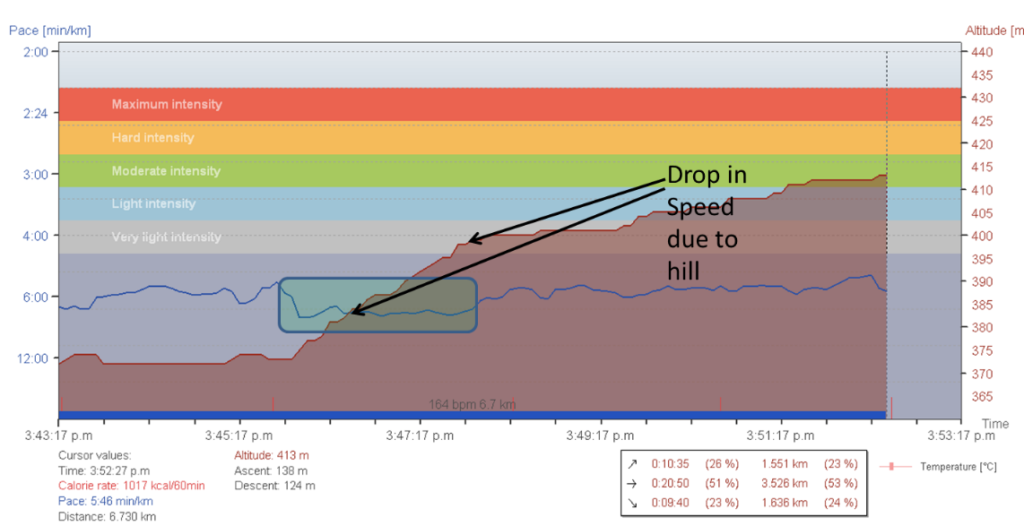
Figure 7. Running speed and altitude over time using a polar hear rate monitor
You will also notice that Figures 4 to 7 are the same situation, and speed and heart rate provide exactly the opposite analysis of intensity in terms of what the runner is doing. One makes it look like the runner is exercising too hard while the other makes it look like they are exercising too gently.
This is why context, is so important to maximizing the value of wearables.
We now have more meaningful and personal information, but we still need to answer the most important question in exercise: what is hard for you? Should my 87-year-old father exercise in the same way as I do? Of course not, we have different physiologies, so we have to calibrate each person’s effort automatically and individually. In Podium, our running app, we do it like this:
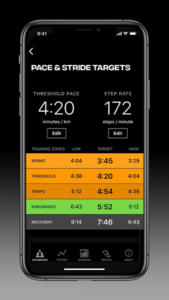
Figure 8. Podium software on the iPhone showing automatically calibrated pace zones.
With context and calibration of effort, we have made your wearable quite a bit smarter. We now need to answer the three key questions that people ask when they exercise:
- What should I do? (what is the workout plan?)
- What did I do? (detecting what the person did)
- How did I do? (measuring improvements)
To answer, “what should I do?” we need to be able to design a plan for the user. It should ask the user a little about themselves, their goals, abilities and preferences, and should produce a customized training program like this:
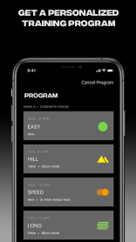
Figure 9. Podium software with fully customized training programs.
This plan has over 90,000 different permutations. It’s not a template, it actually writes a customized plan.
To answer “what did I do?” we need a way to detect the nuances and context in your exercise to know precisely what you did. So we invented Activity Types to solve the context problem already discussed.
Activity Types are contextual training zones which differ from traditional one parameter training zones like heart rate by using two parameter zones like a speed zone and a terrain zone together. If your data matches both parameter zones at the same time we know that you are running fast up a hill. This can also be applied many situations like blood pressure, heart rate and many other types of data. In the graphic below, we are detecting all the different types of Activity within a cycling workout.
This mess of data…
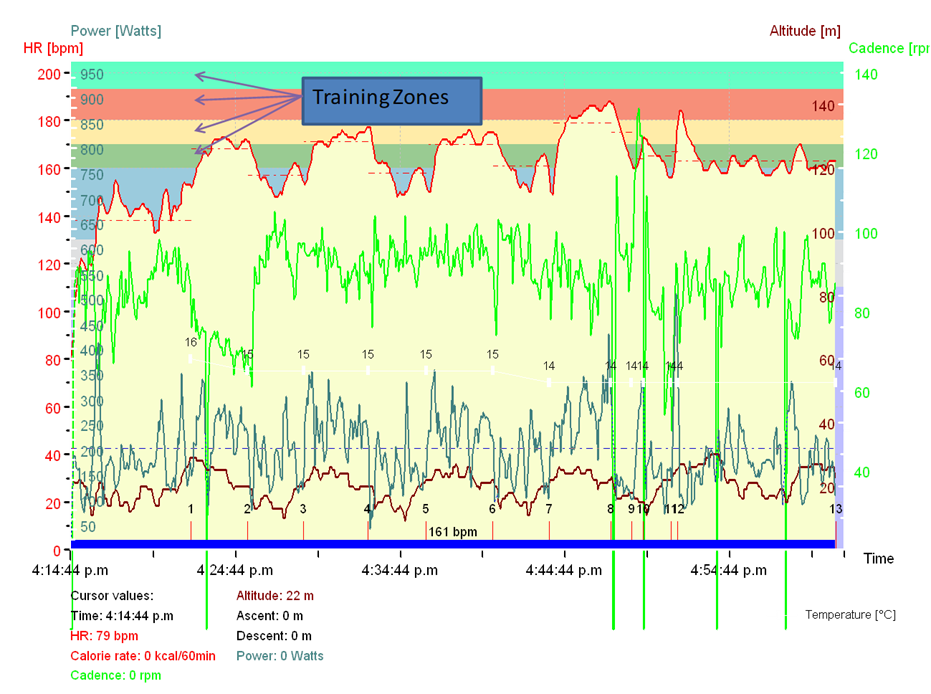
Figure 10. The tangle of heart rate, speed, cadence, power and altitude data for a cycling workout measured on a polar device
..can be untangled into these detected activities:
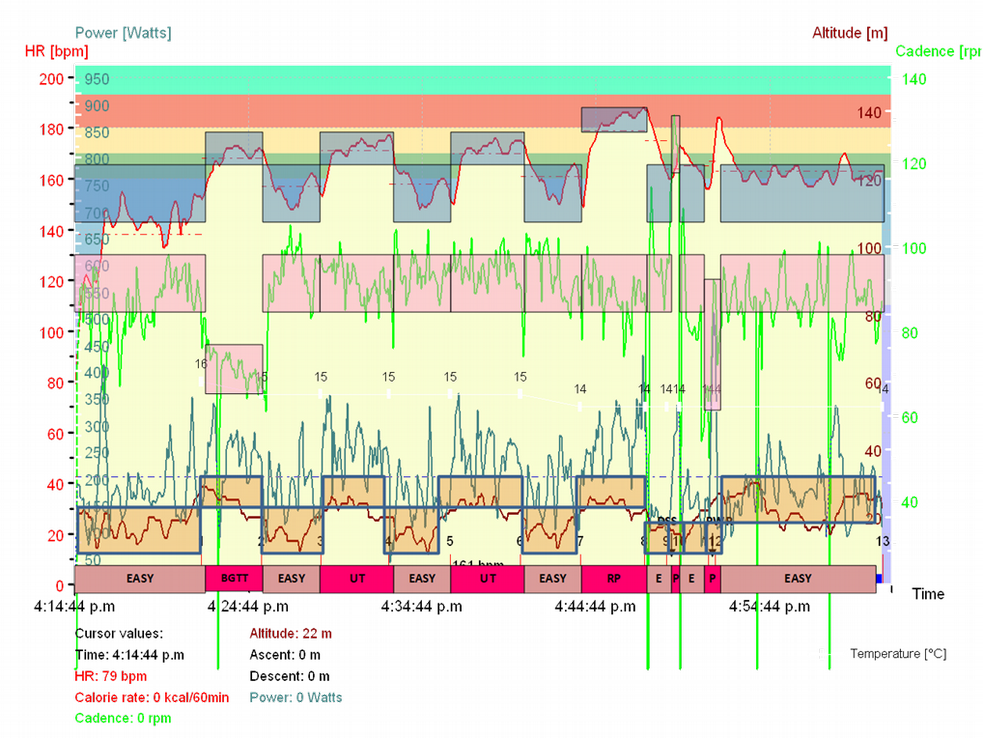
Figure 11. Graphic illustrating how simultaneous contextual training zones untangles complex physiological data applied to data that detects subtly different cycling activities from a polar device.
In this case, each Training Type uses three simultaneous zones to detect a user’s activity. You can see the simultaneous zones and also the detected Activity Types along the bottom of the graph above. (e.g. Easy, BGTT, UT, RP & P)
We now know what you did which we can analyse or compare to the plan to see your compliance.
Finally, we need to know whether this activity is beneficial or not. We need to measure your changes in fitness. We need two types of data to get this. We need your heart rate and we also need to invent a way to get running or walking power which we’ve done.
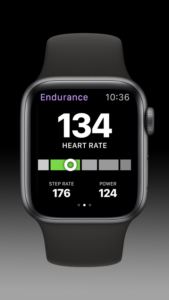
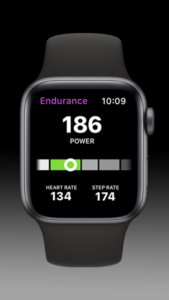
Figure 12. Podium software on the Apple Watch which has the capacity to measure both running power and hear rate data simultaneously
If you remember your old physiology classes, you’ll remember those old bike ergometer inferred VO2max tests where you needed power and heart rate to infer cardiovascular fitness. Well, we came up with a way so it’s now possible to get a cardiovascular status every time you go out for a run.
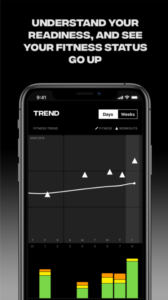
Figure 13. Podium Cardiovascular Fitness Status Measures Over Days or Weeks with Training Mix Histogram Below Made Up of Easy Running (Green), Climbing (Yellow) and Speed Training (Orange).
We can now answer the 3 questions:
- What should I do?
- What did I do?
- How did I do?
This means we can provide real coaching instead of just another pile of meaningless metrics.
We just have one last task to perform. Once we’ve answered the three questions for today’s workout, this information allows us to go back and answer the first question (what should I do?) again for the next workout. It all becomes a seamless interconnected set of algorithms all working together in a feedback loop to help you maximize your results every time to do a workout.
The old paradigm of wearables is:
- Plan (if you have one)
- Measure
- Stop at a dead end where just metrics are reported
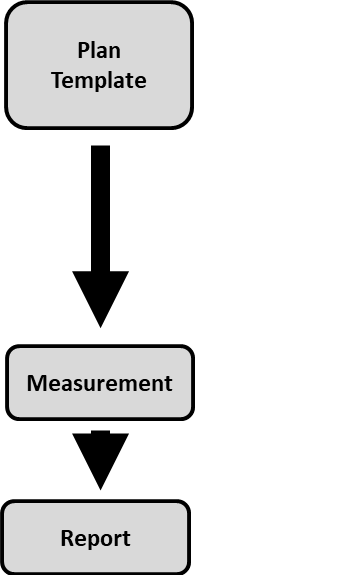
Figure 15. The Current and Potentially Old Paradigm For Wearables.
The new paradigm, the feedback loop, means we can begin to answer the three questions and coach.
It is smart enough to understand your goals, personal ability, preferences, correct efforts, training types, compliance, and fitness.
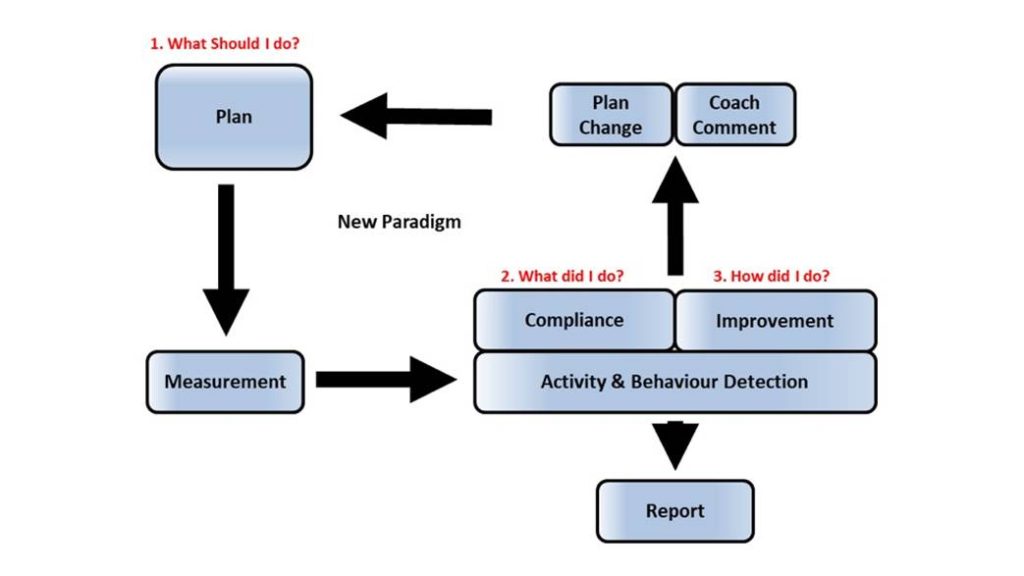 Figure 16. Podium’s New Paradigm For Wearable Technology.
Cover Image: credit MaxPixel